CLAIMS PERFORMANCE DASHBOARD
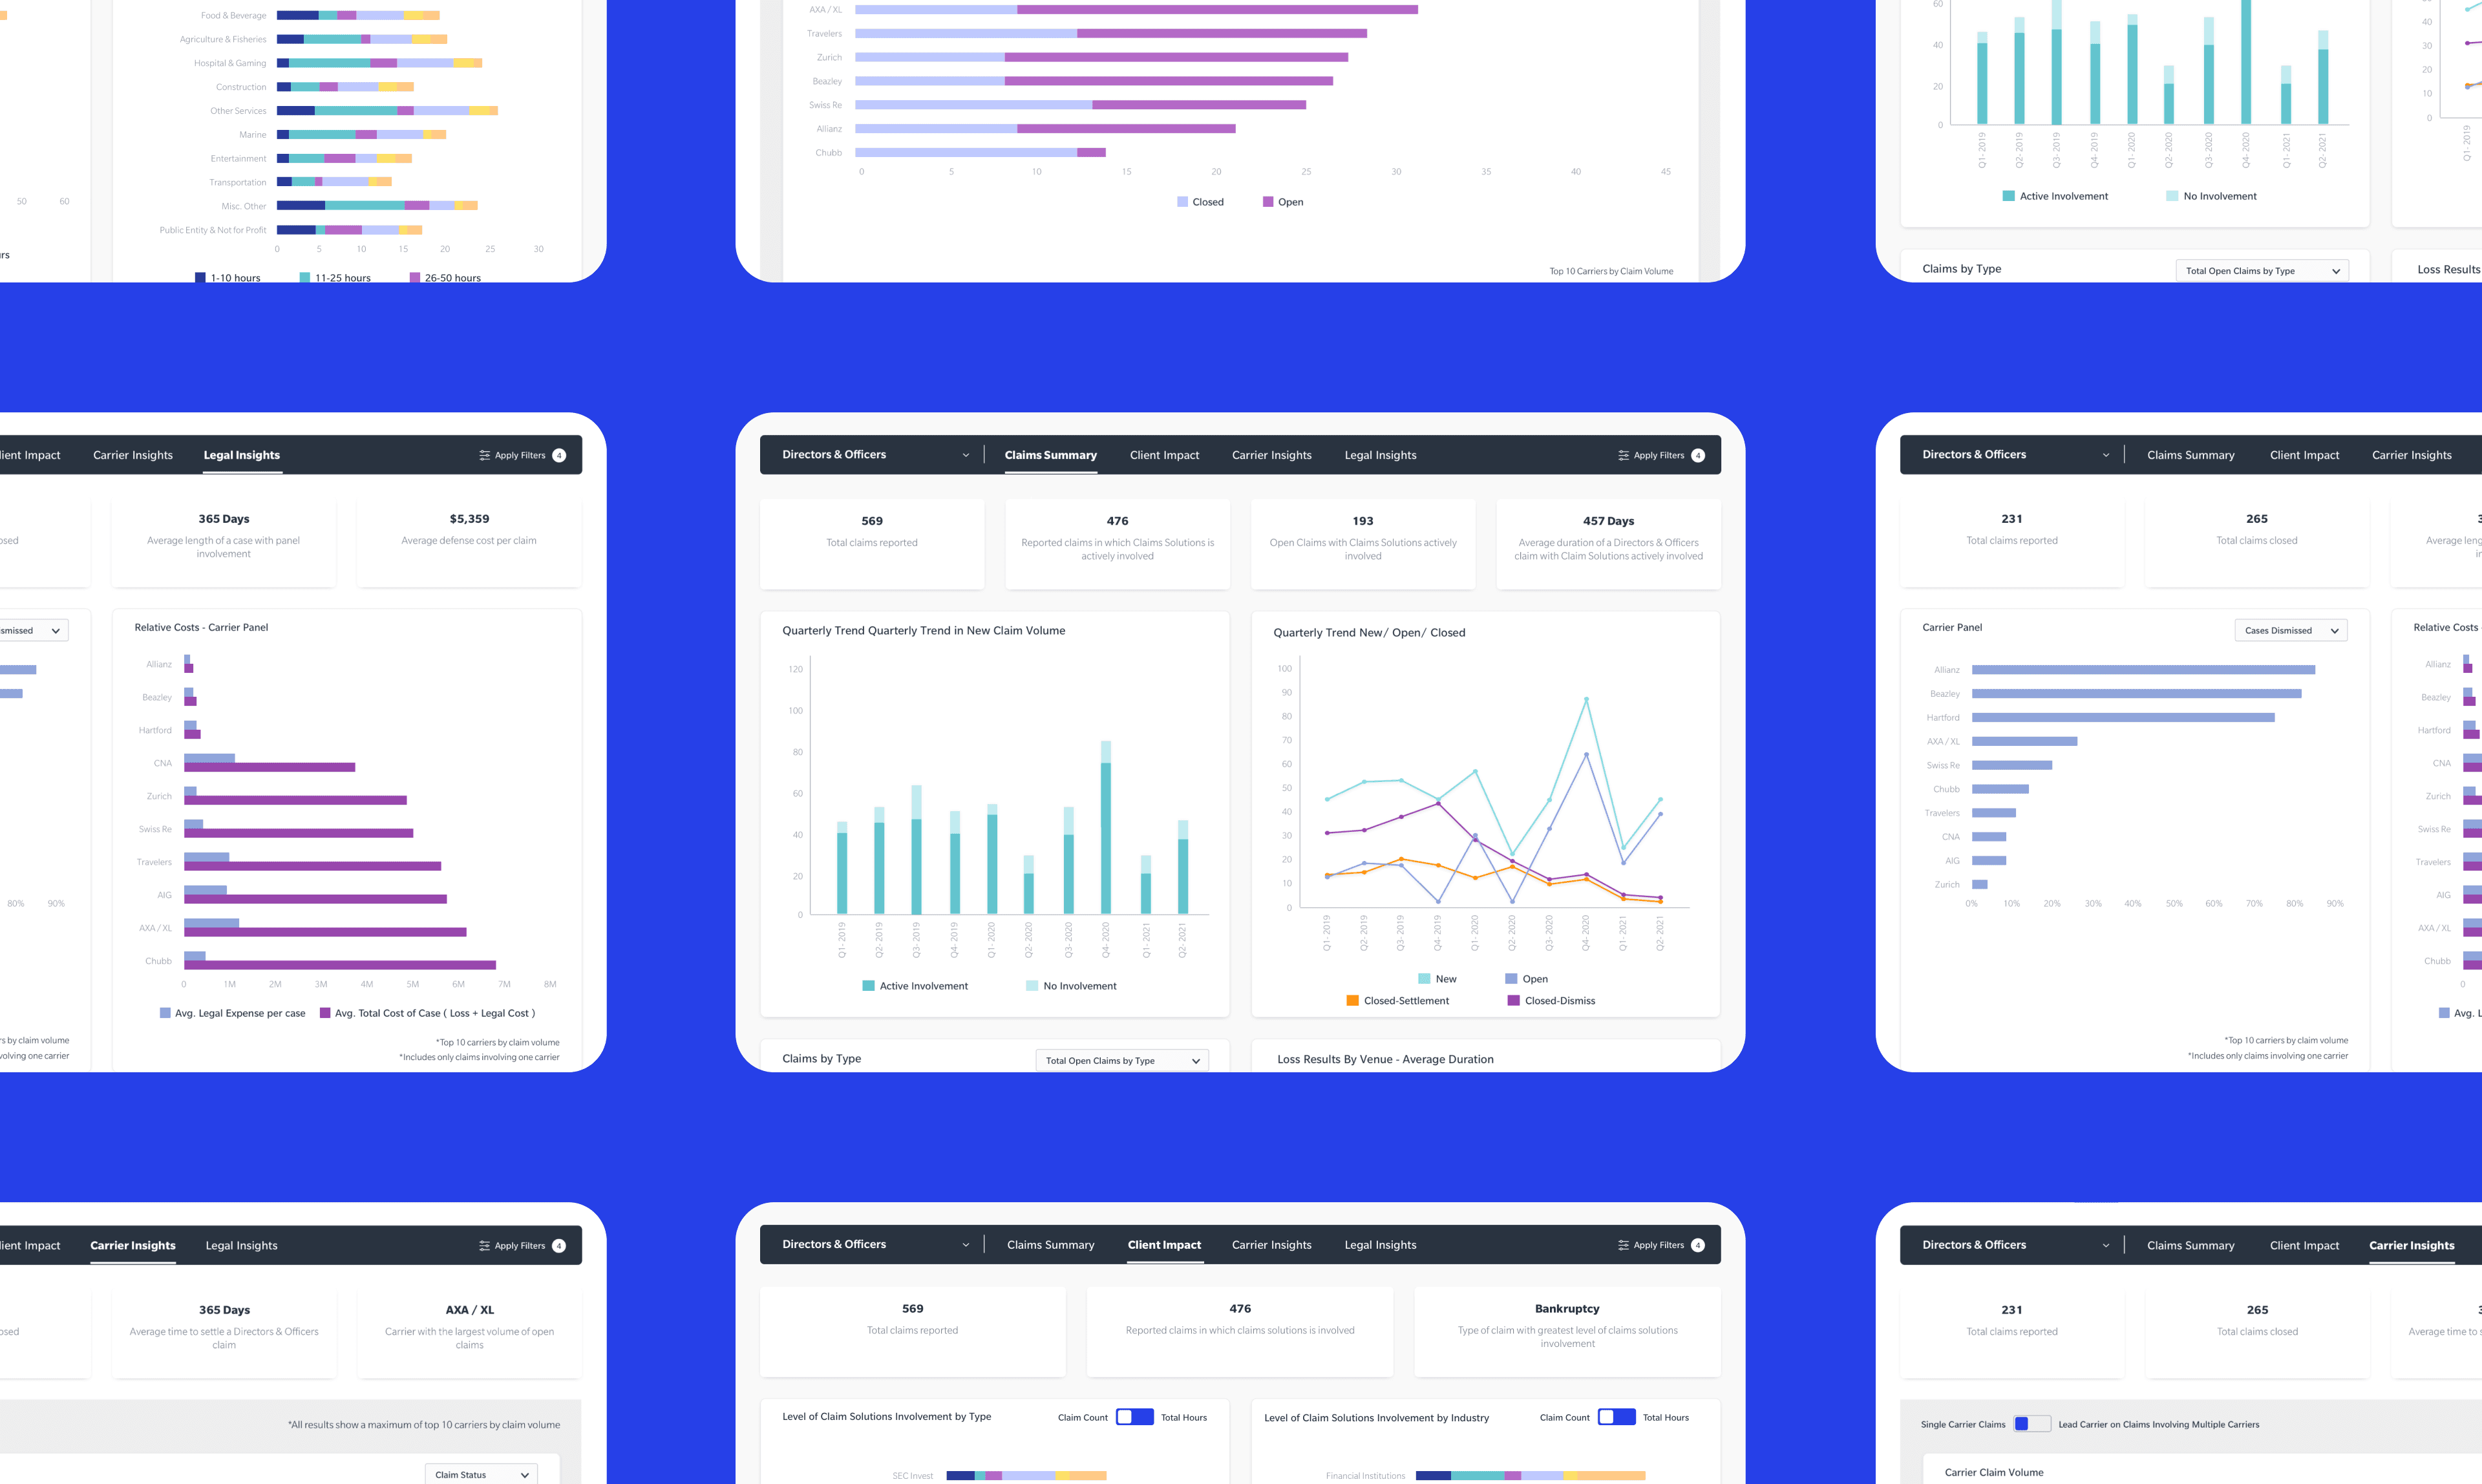
Turning complex claims data into decision-ready insights within Blue[i]
ABOUT MARSH
Marsh McLennan is a global insurance brokerage and risk advisory firm that helps enterprises manage risk, insurance placement, and claims across complex, multi-region portfolios. Claims data sits at the center of this work, informing financial exposure, legal risk, operational efficiency, and client strategy.
To support this at scale, Marsh built Blue[i], a centralized analytics platform designed to consolidate data from across the insurance lifecycle and enable consistent, self-serve insight for internal teams and clients. Within Blue[i] the Claims Performance Dashboard focuses on translating high-volume, legally and financially sensitive claims data into decision-ready insights for executives, managers, and analysts.
Role
Product Design
Duration
1 year
Team
1x Designer
4x Engineers
1x Project Manager
PROBLEM
All the data. Still the questions
Fragmented insights across tools and static reports
Executives needed fast visibility without analyst mediation
Analysts needed depth without overwhelming leadership
Lack of a shared analytics UX framework
Despite extensive claims data, time-to-insight was high, slowing decision-making across leadership and analytical workflows.
SCOPE
Focused ownership within a larger platform
My scope focused on the Claims Report module within the broader claims analytics platform, working closely with the Scan and Optimize teams to translate upstream analysis into decision-ready reporting.
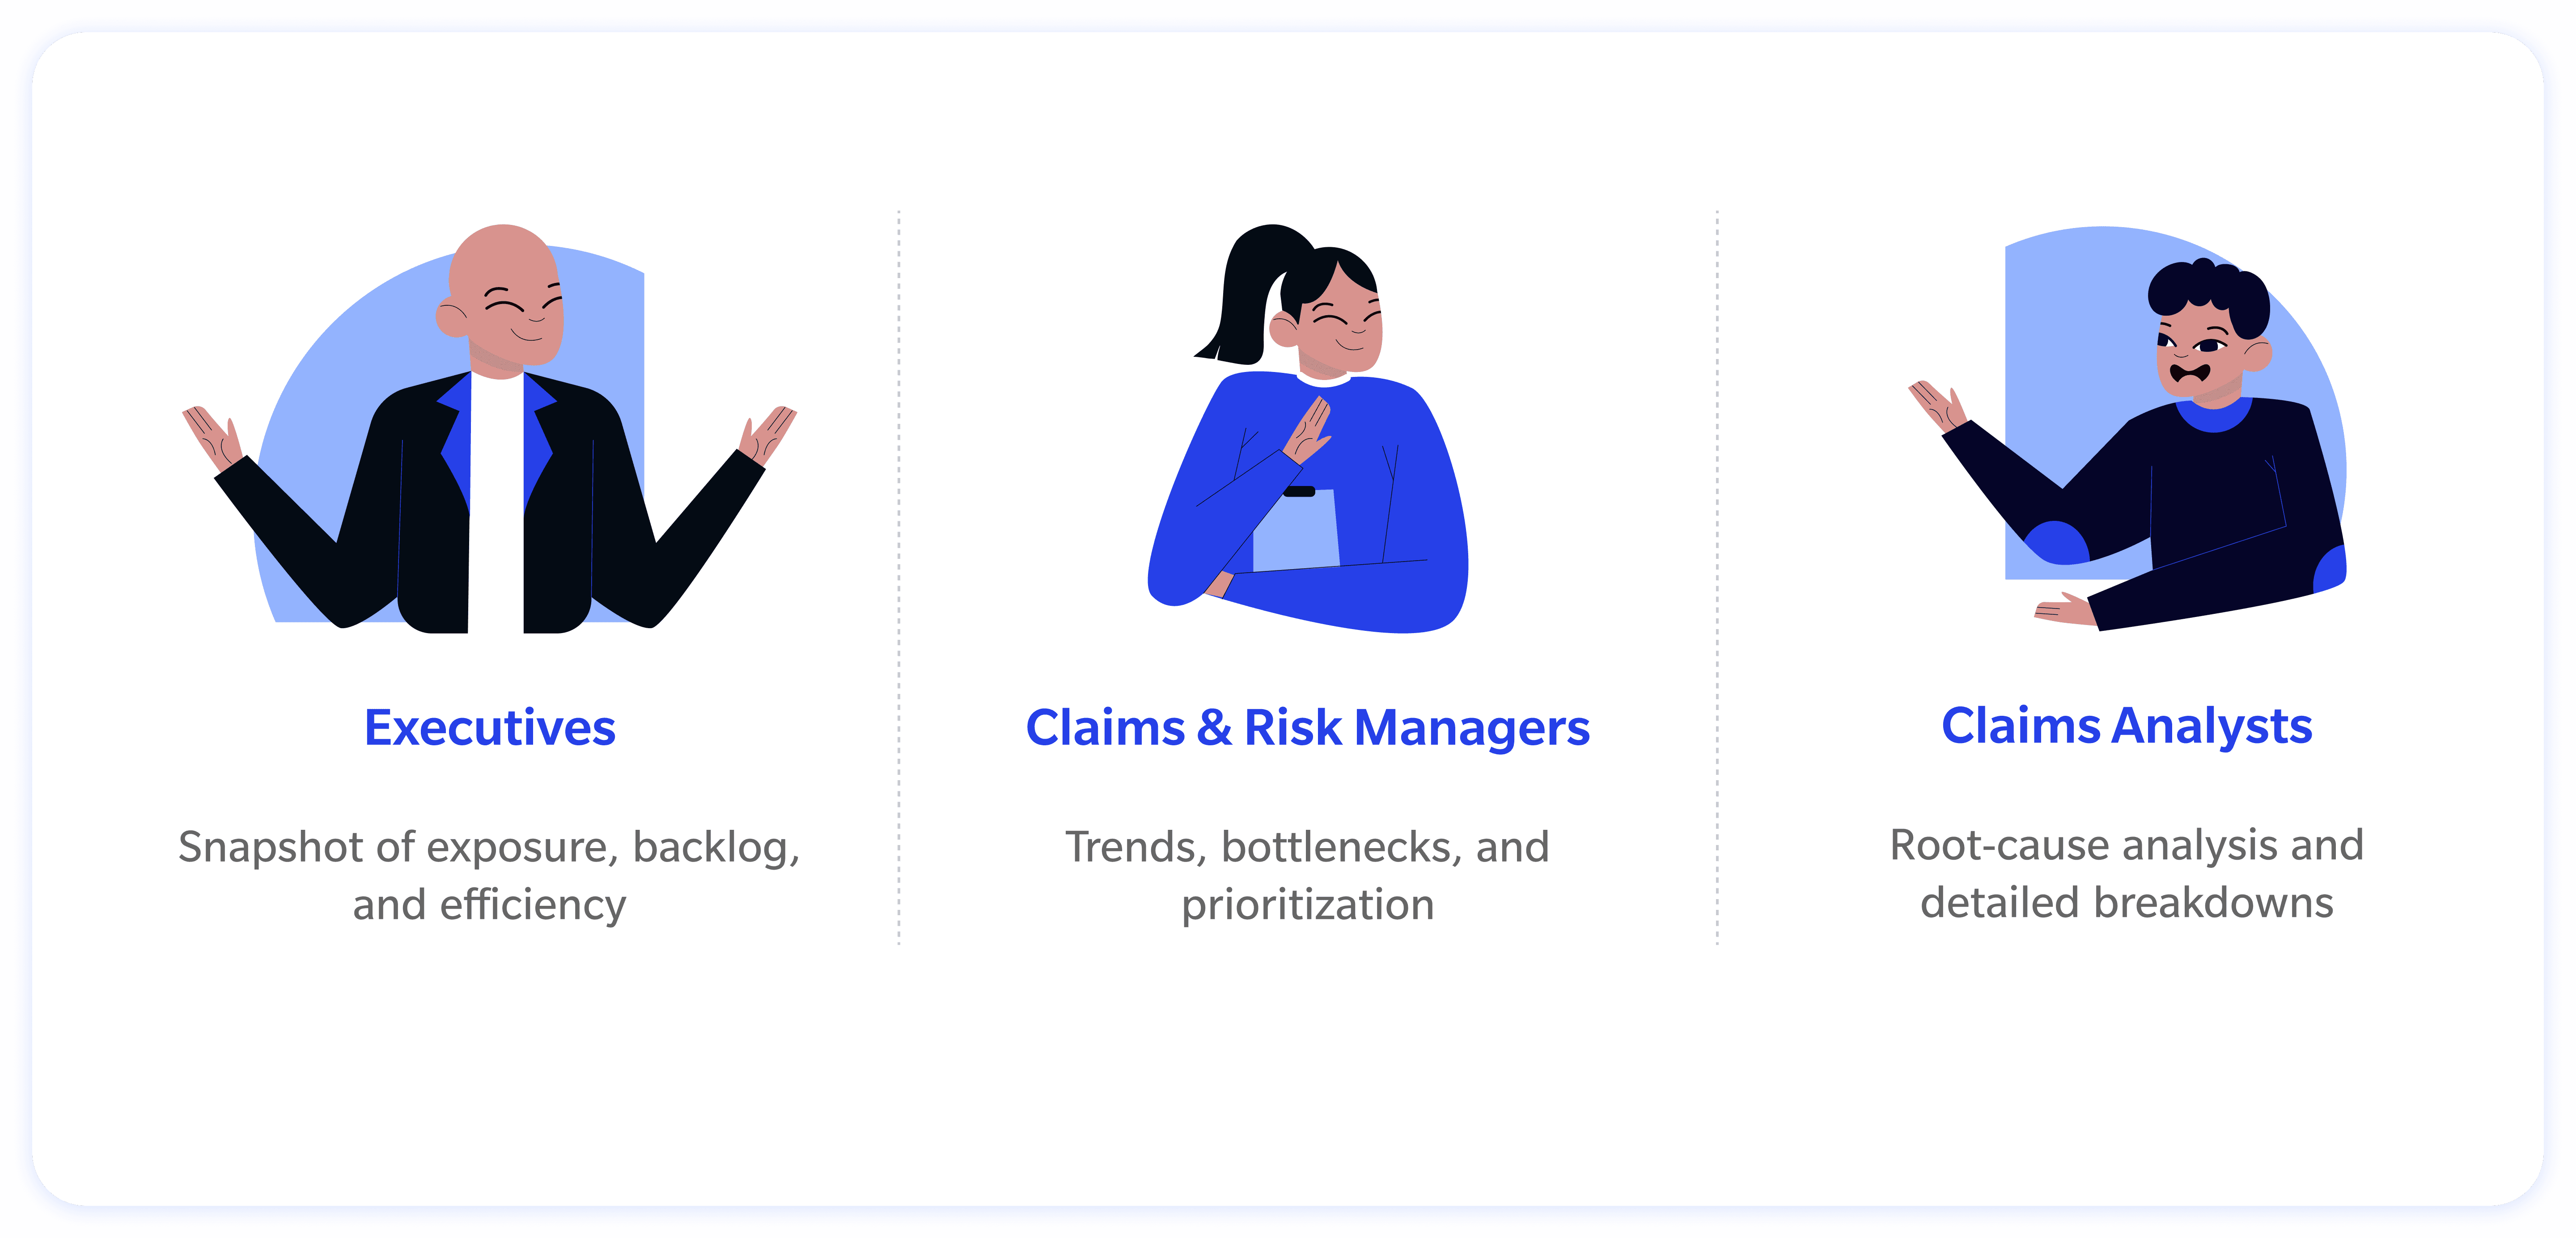
PRIMARY USER NEEDS
One system, many decision makers
A key design goal was ensuring each role could stop at the level of detail they needed, without forcing everyone into deep analysis or hiding critical context.
KEY DESIGN DECISIONS
Turning data into decisions
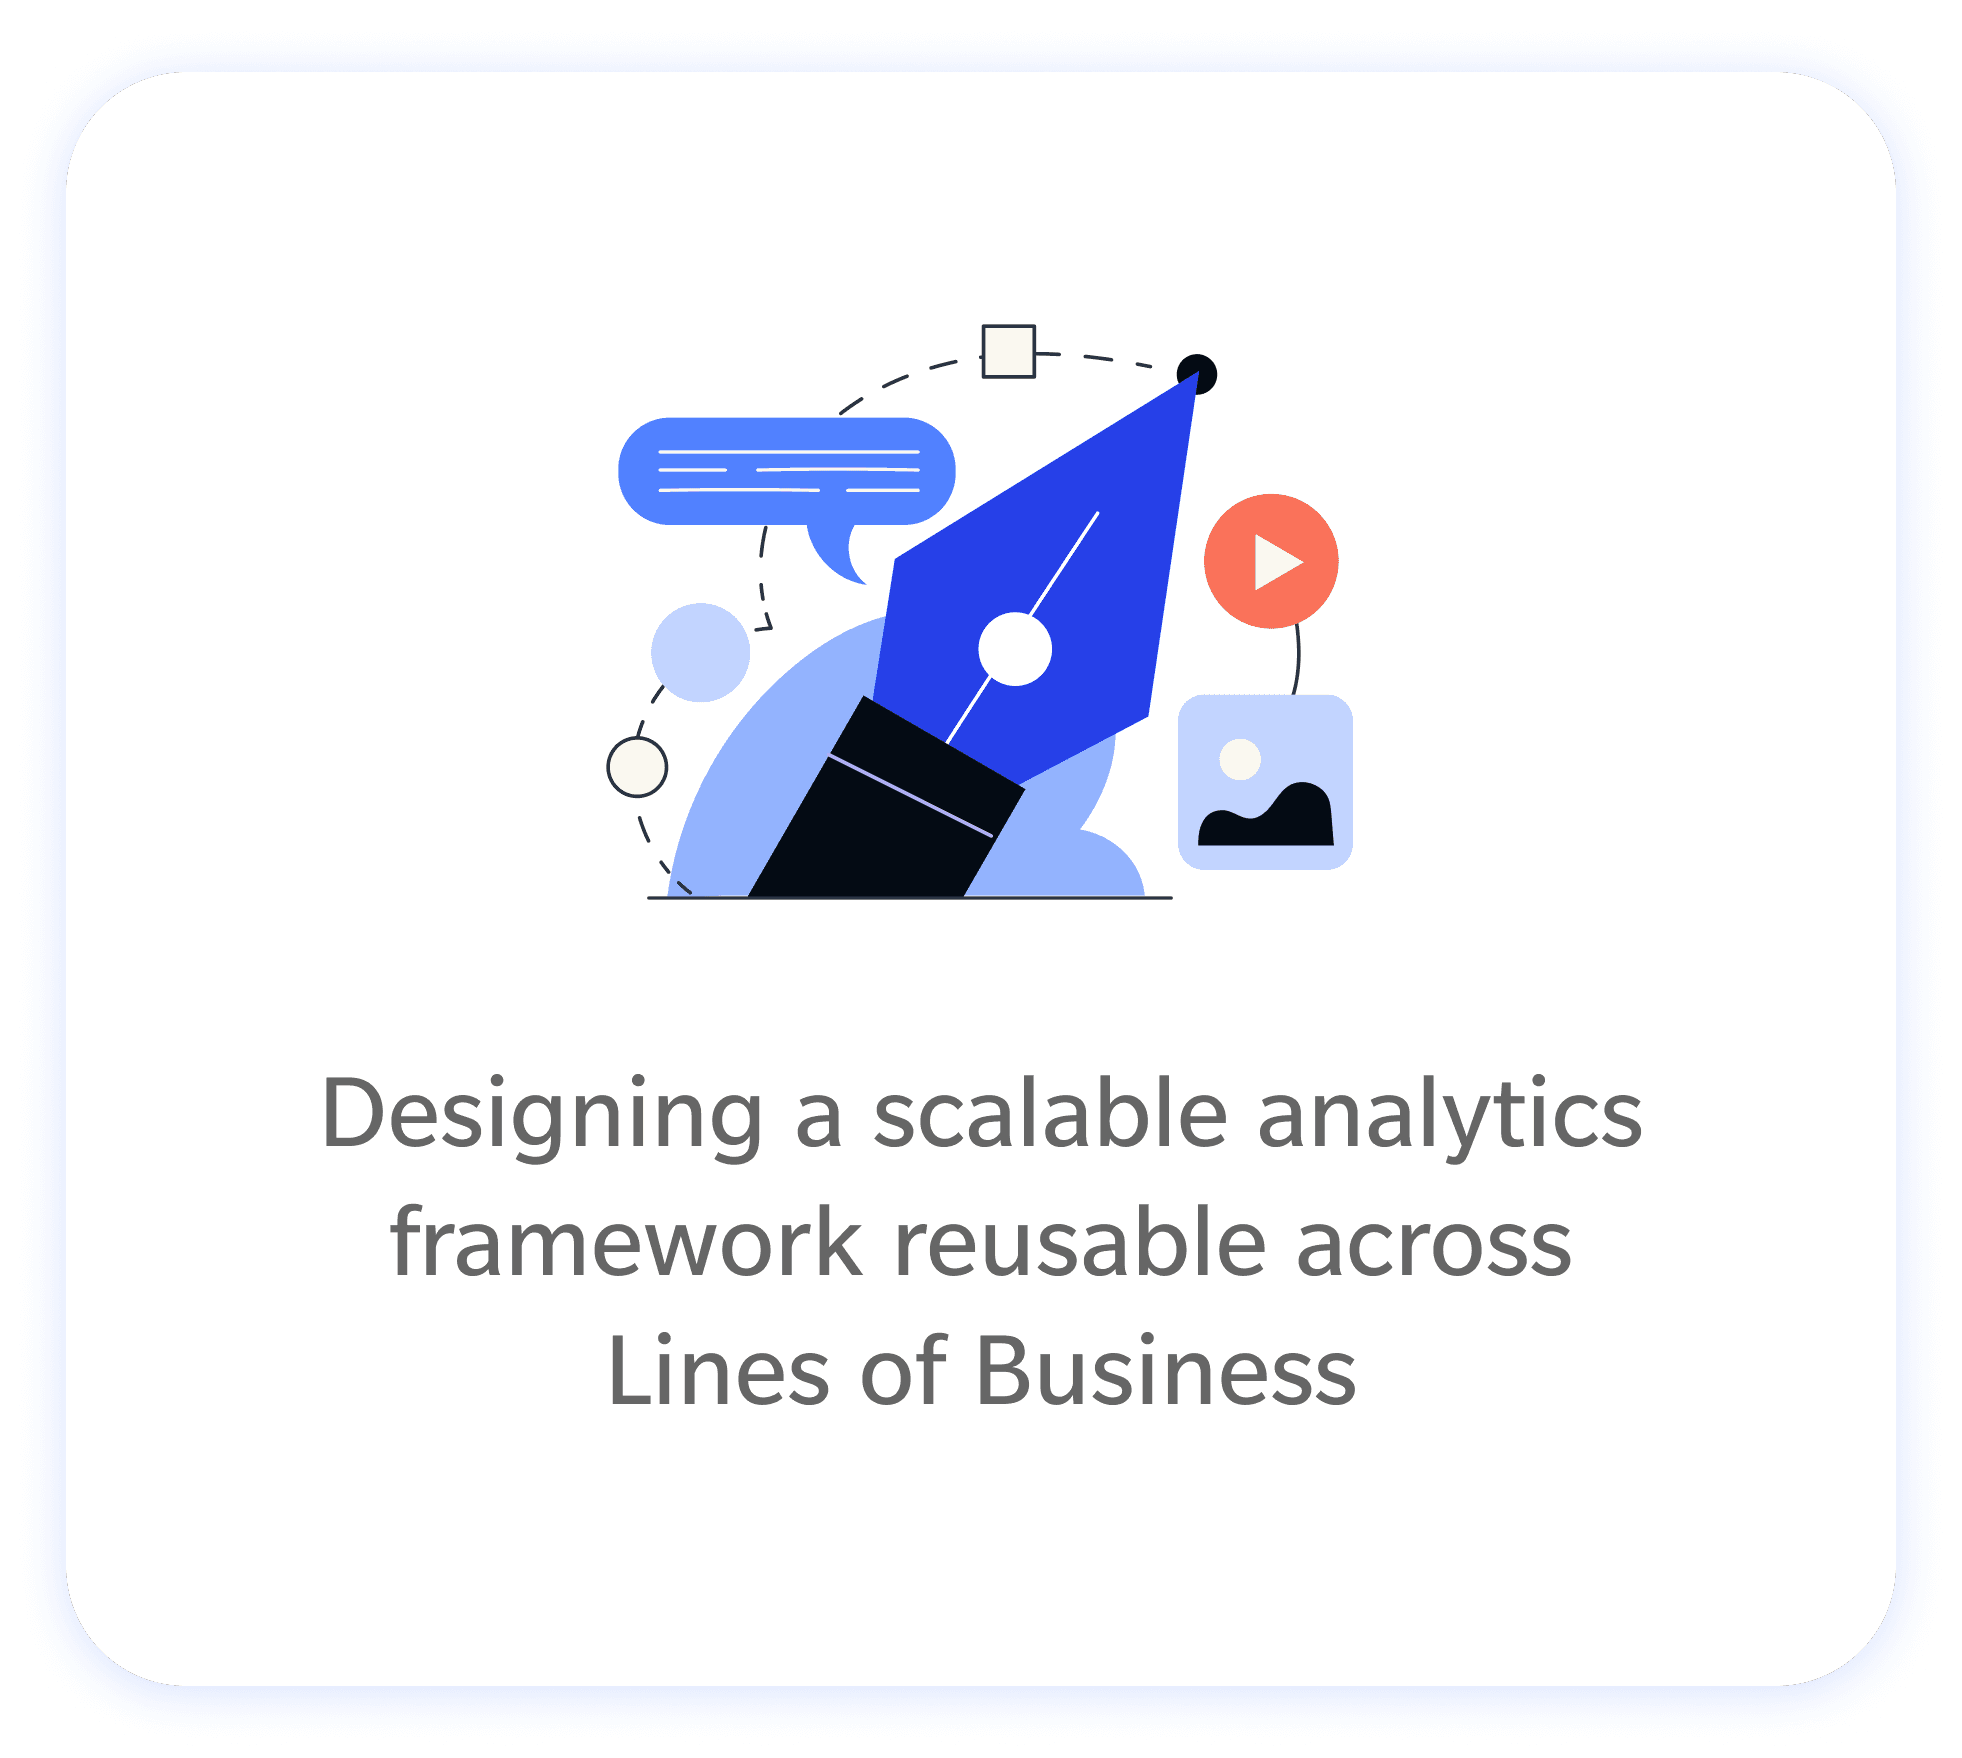
Standardised analytical structure
A single analytical framework applied across Property, Casualty, and FINPRO, enabling consistent interpretation across Lines of Business.
Claims Summary
Set context
Client Impact
Highlight financial impact
Carrier Insights
Reveal external performance drivers
Legal Insights
Explain sources of complexity and delay
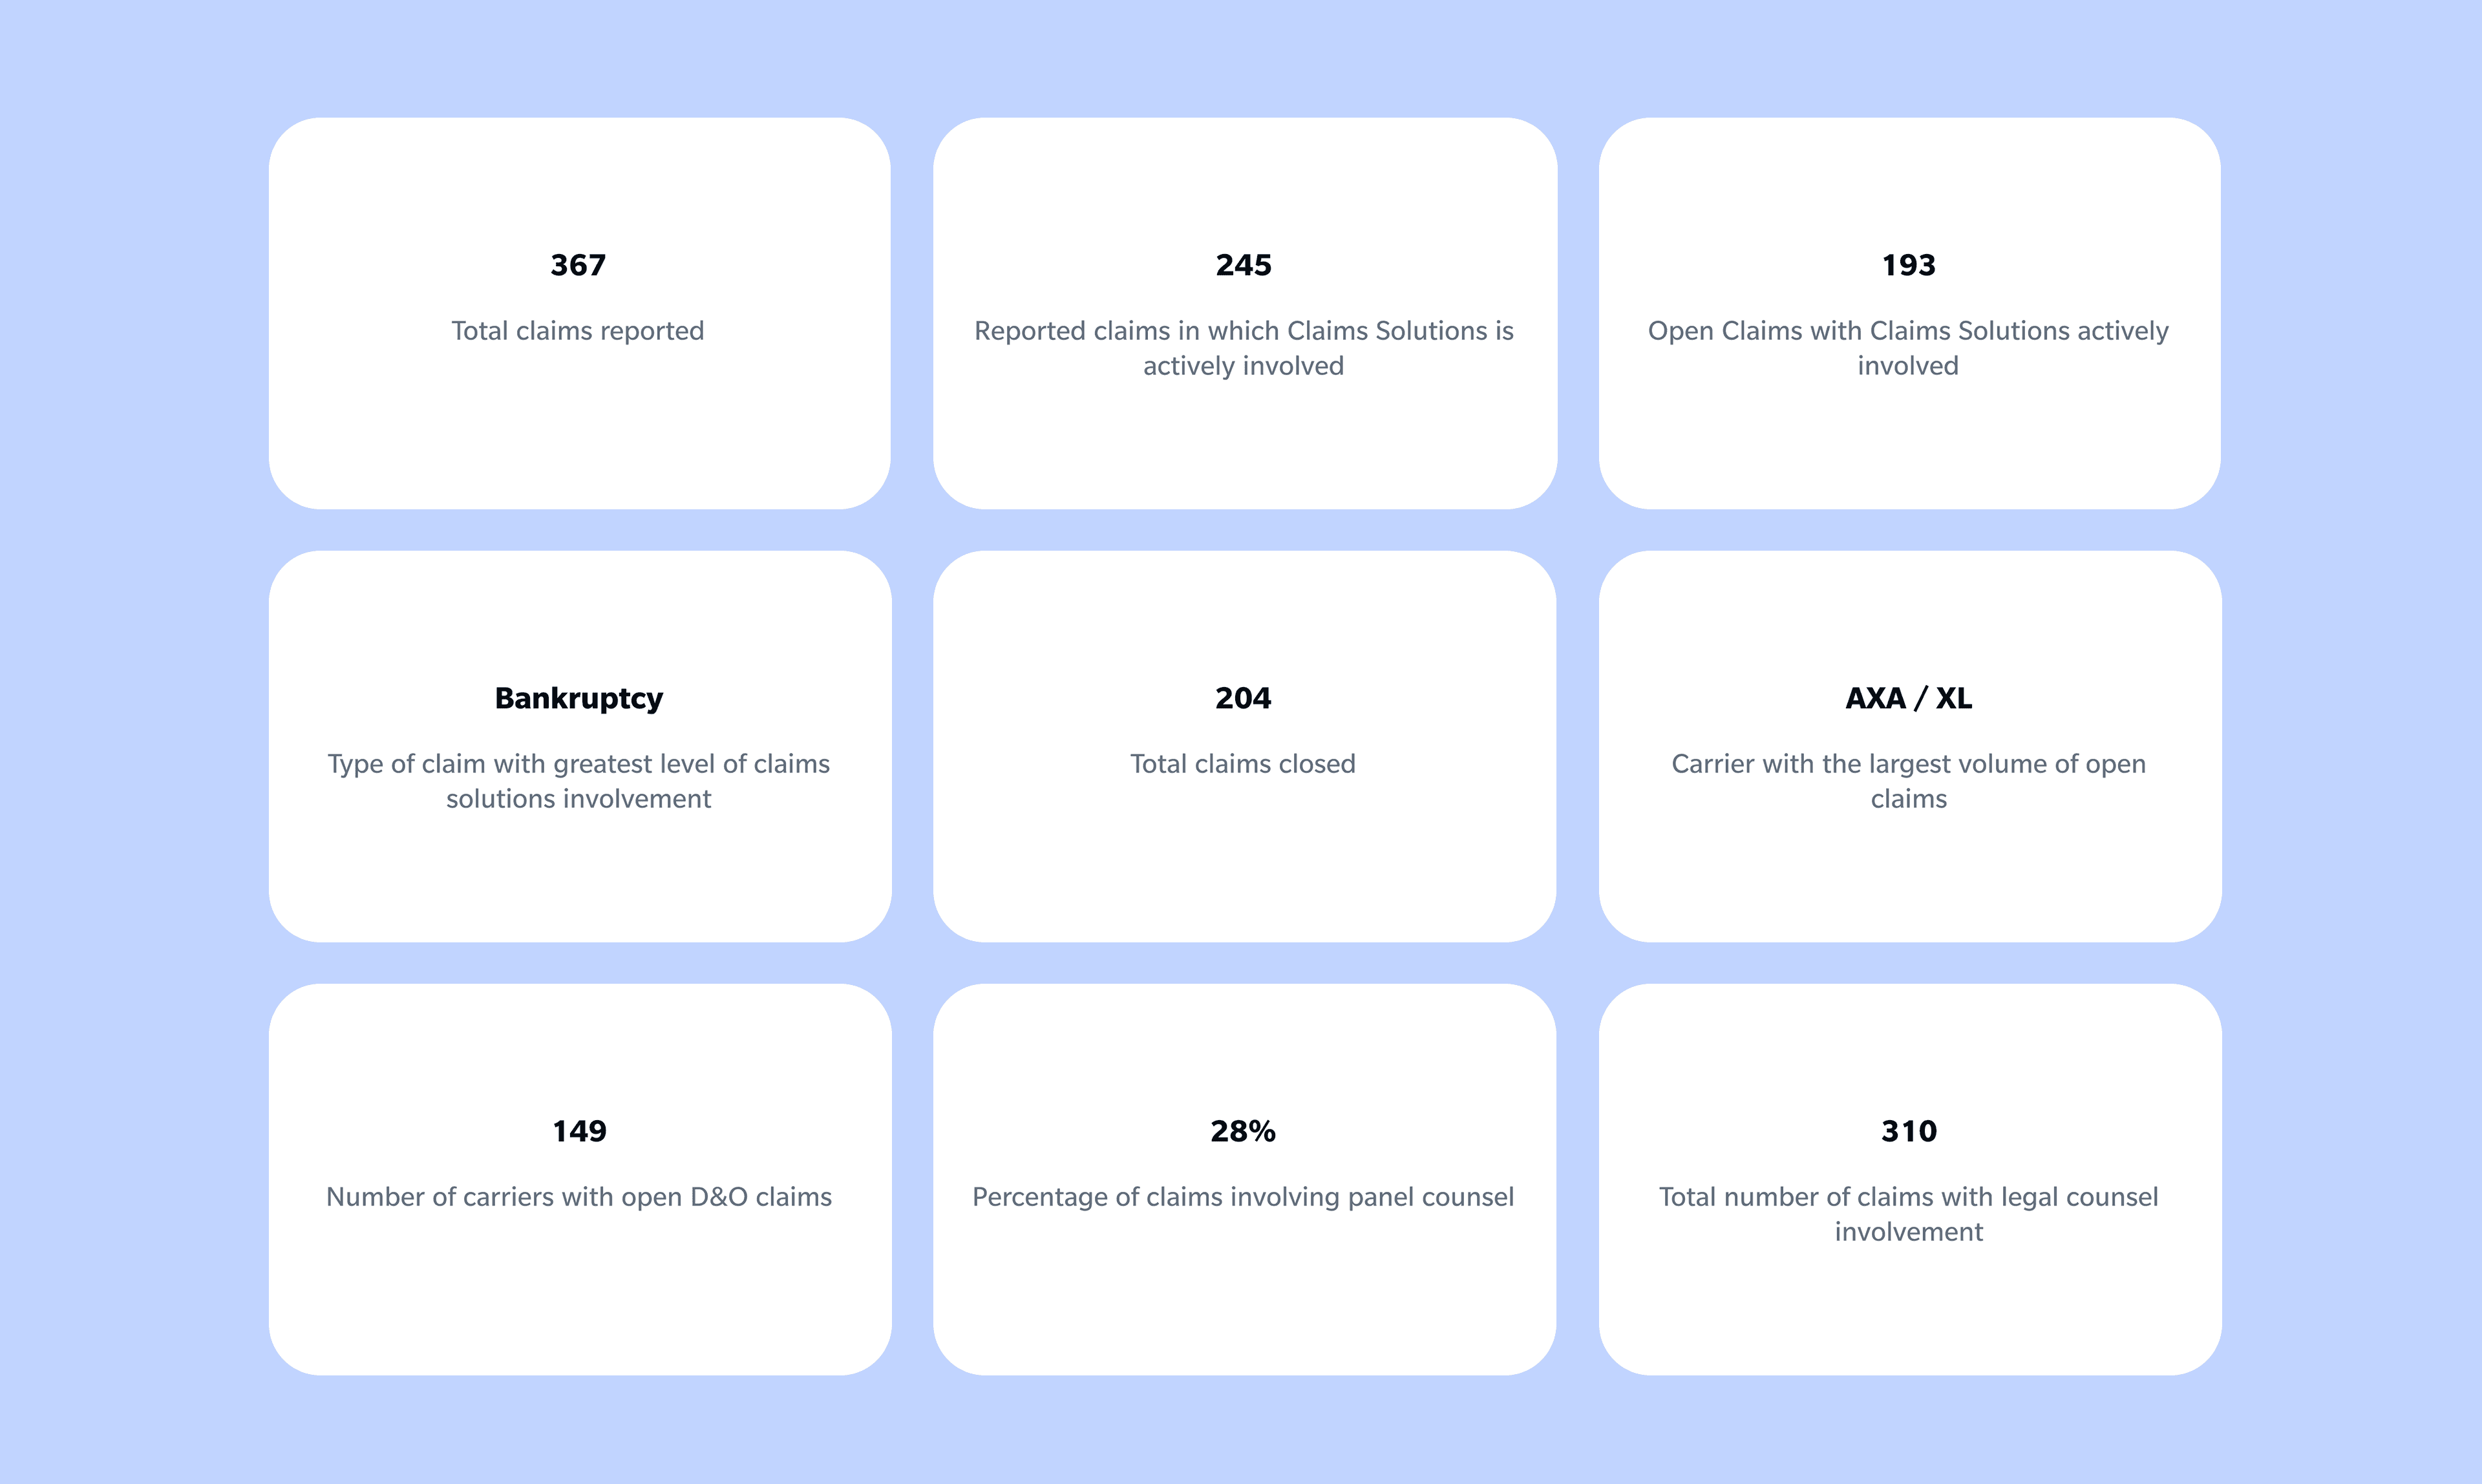
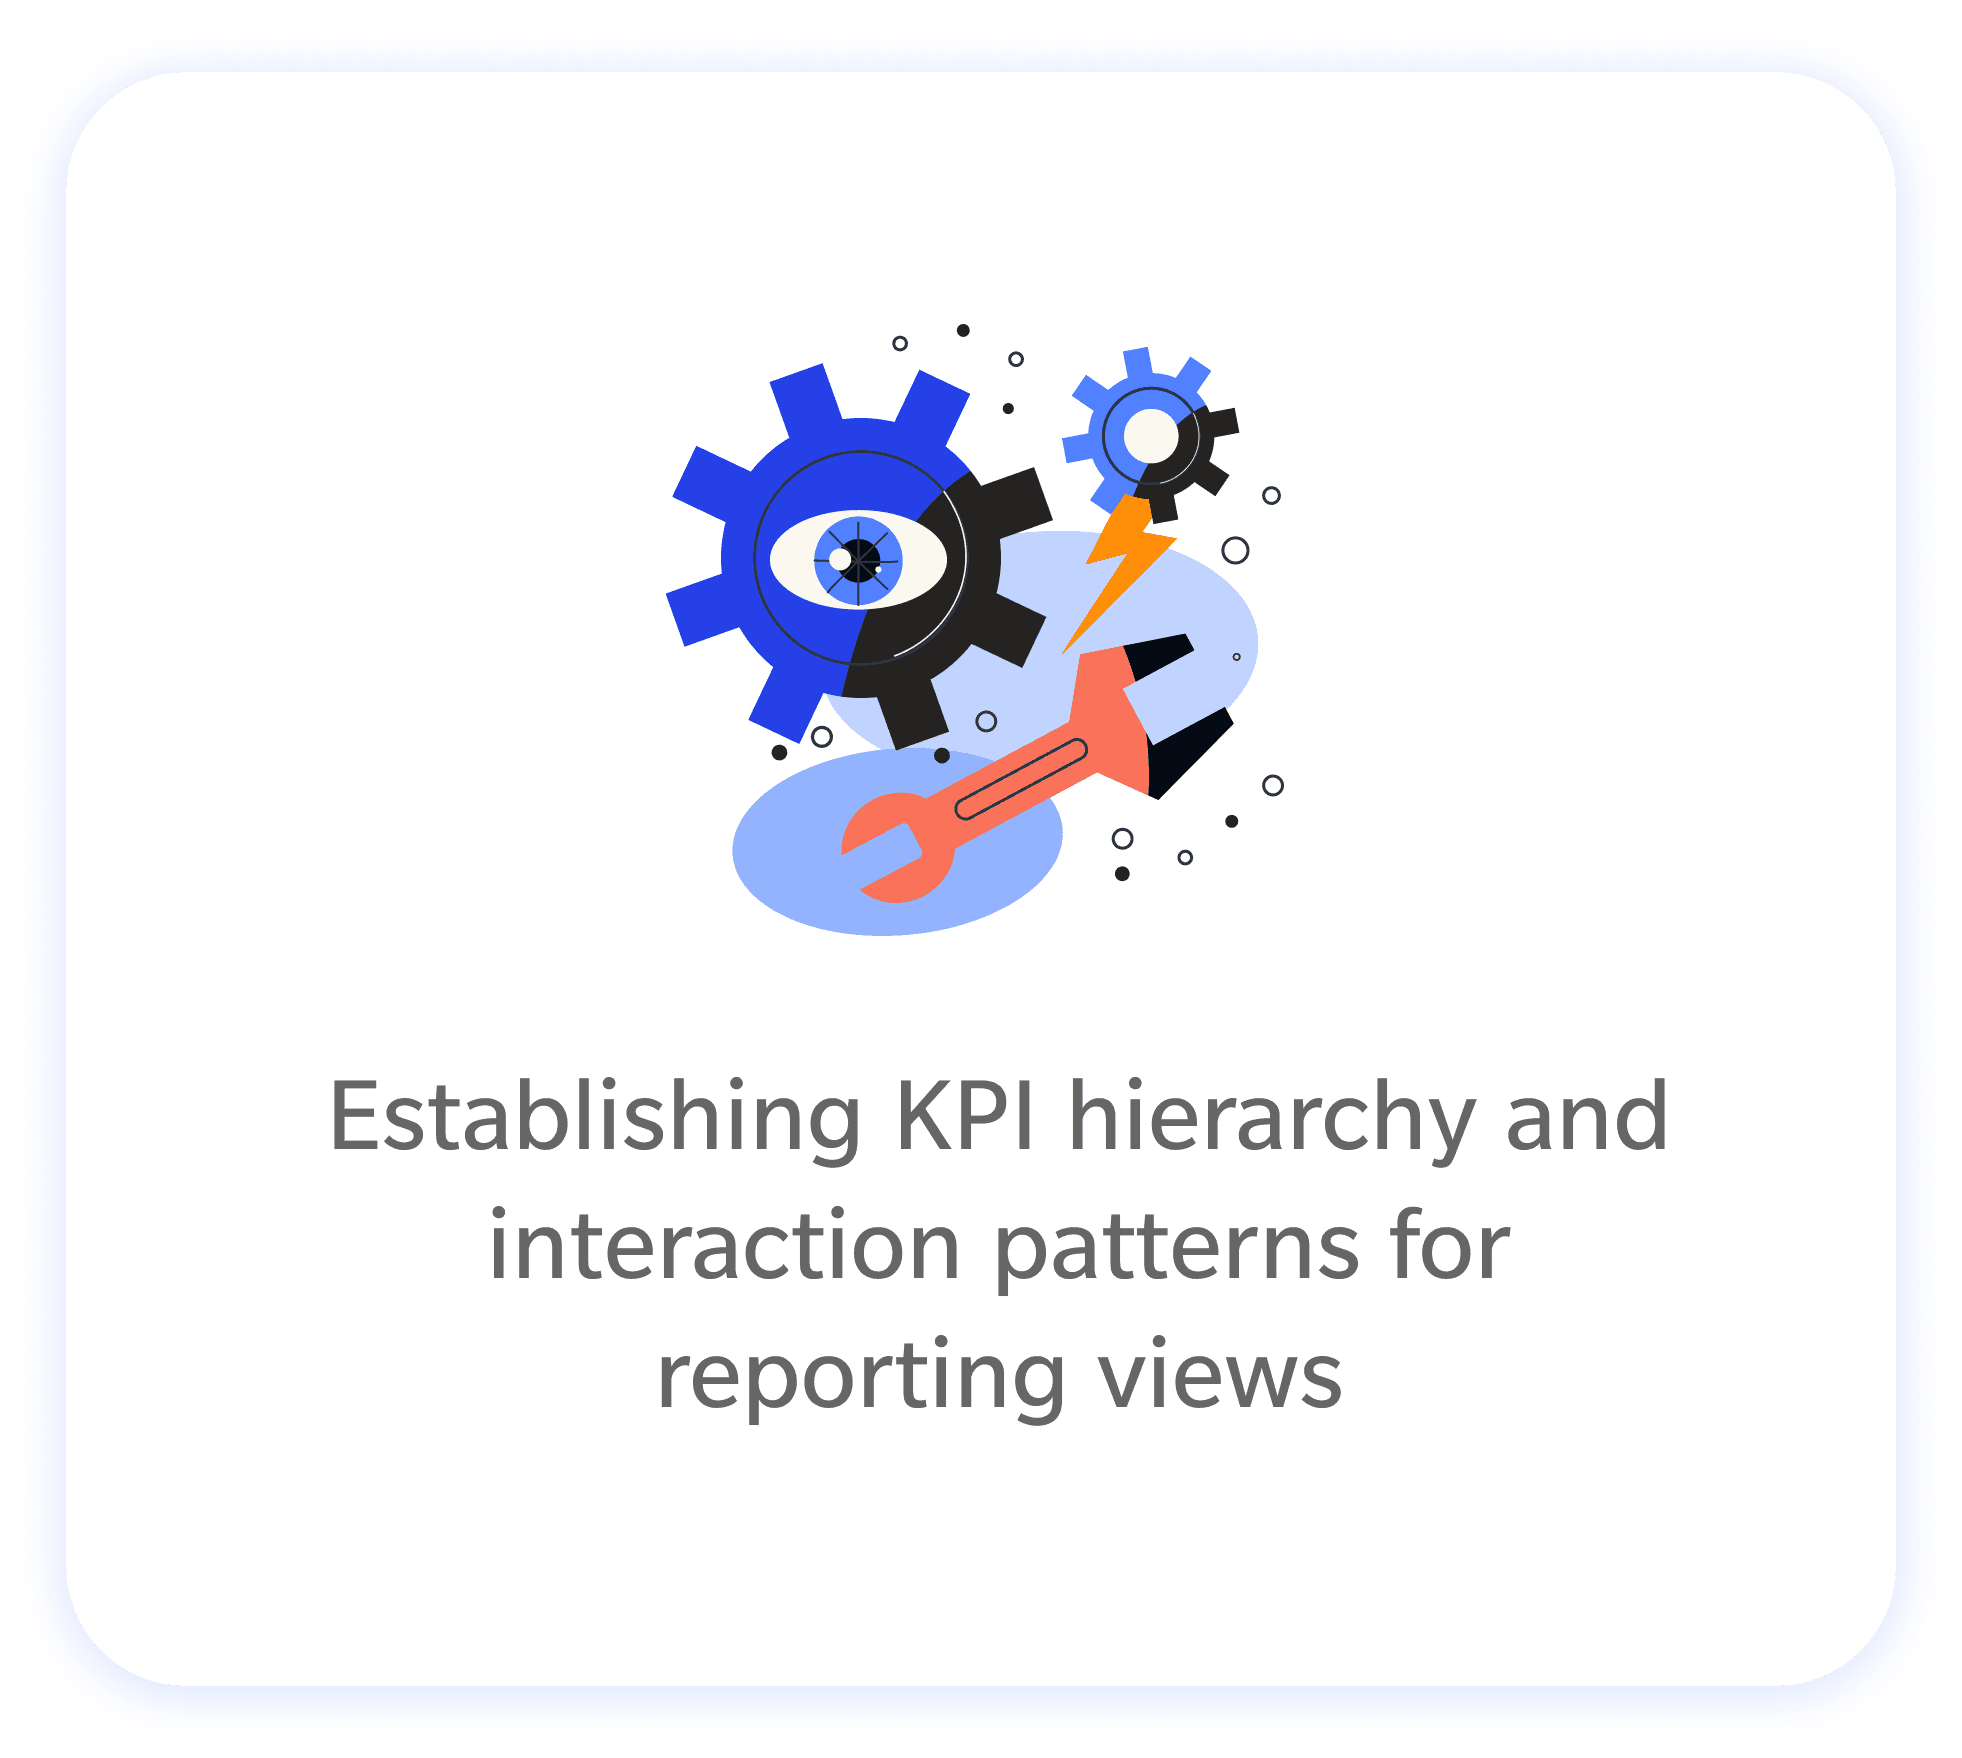
KPI hierarchy over data density
Designed the Key Performance Indicators hierarchy around operational risk rather than raw activity; surfacing involvement, backlog, and duration to help teams quickly identify where claims required attention.
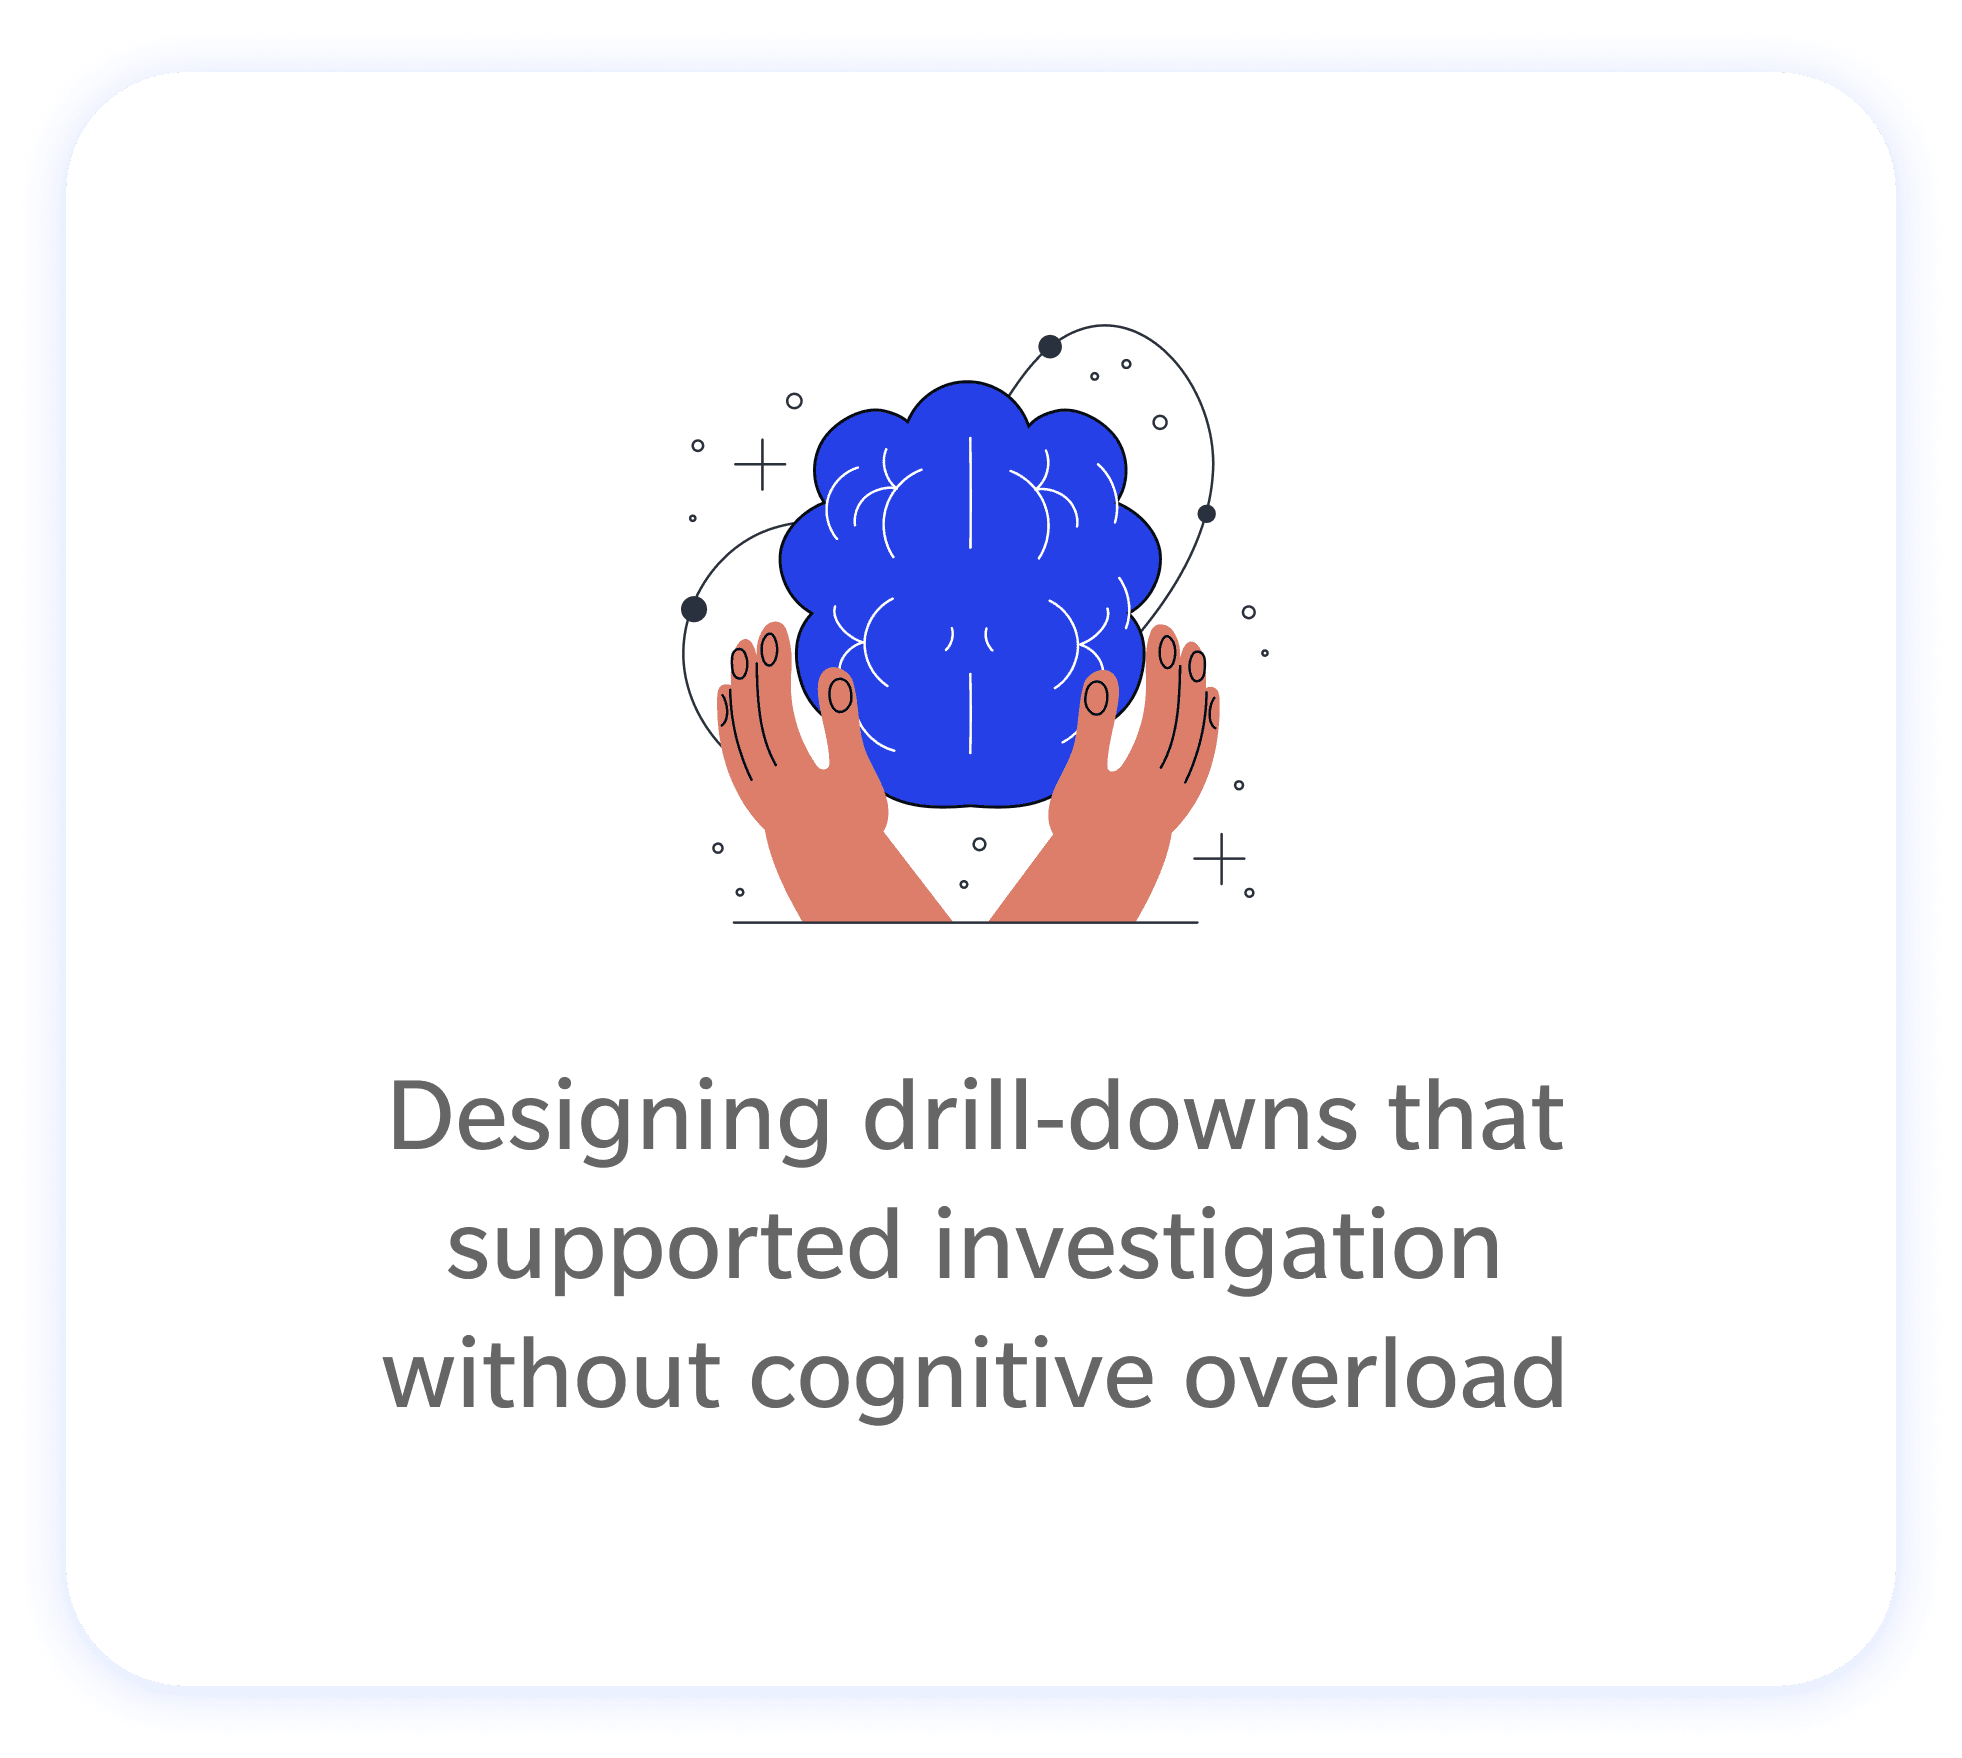
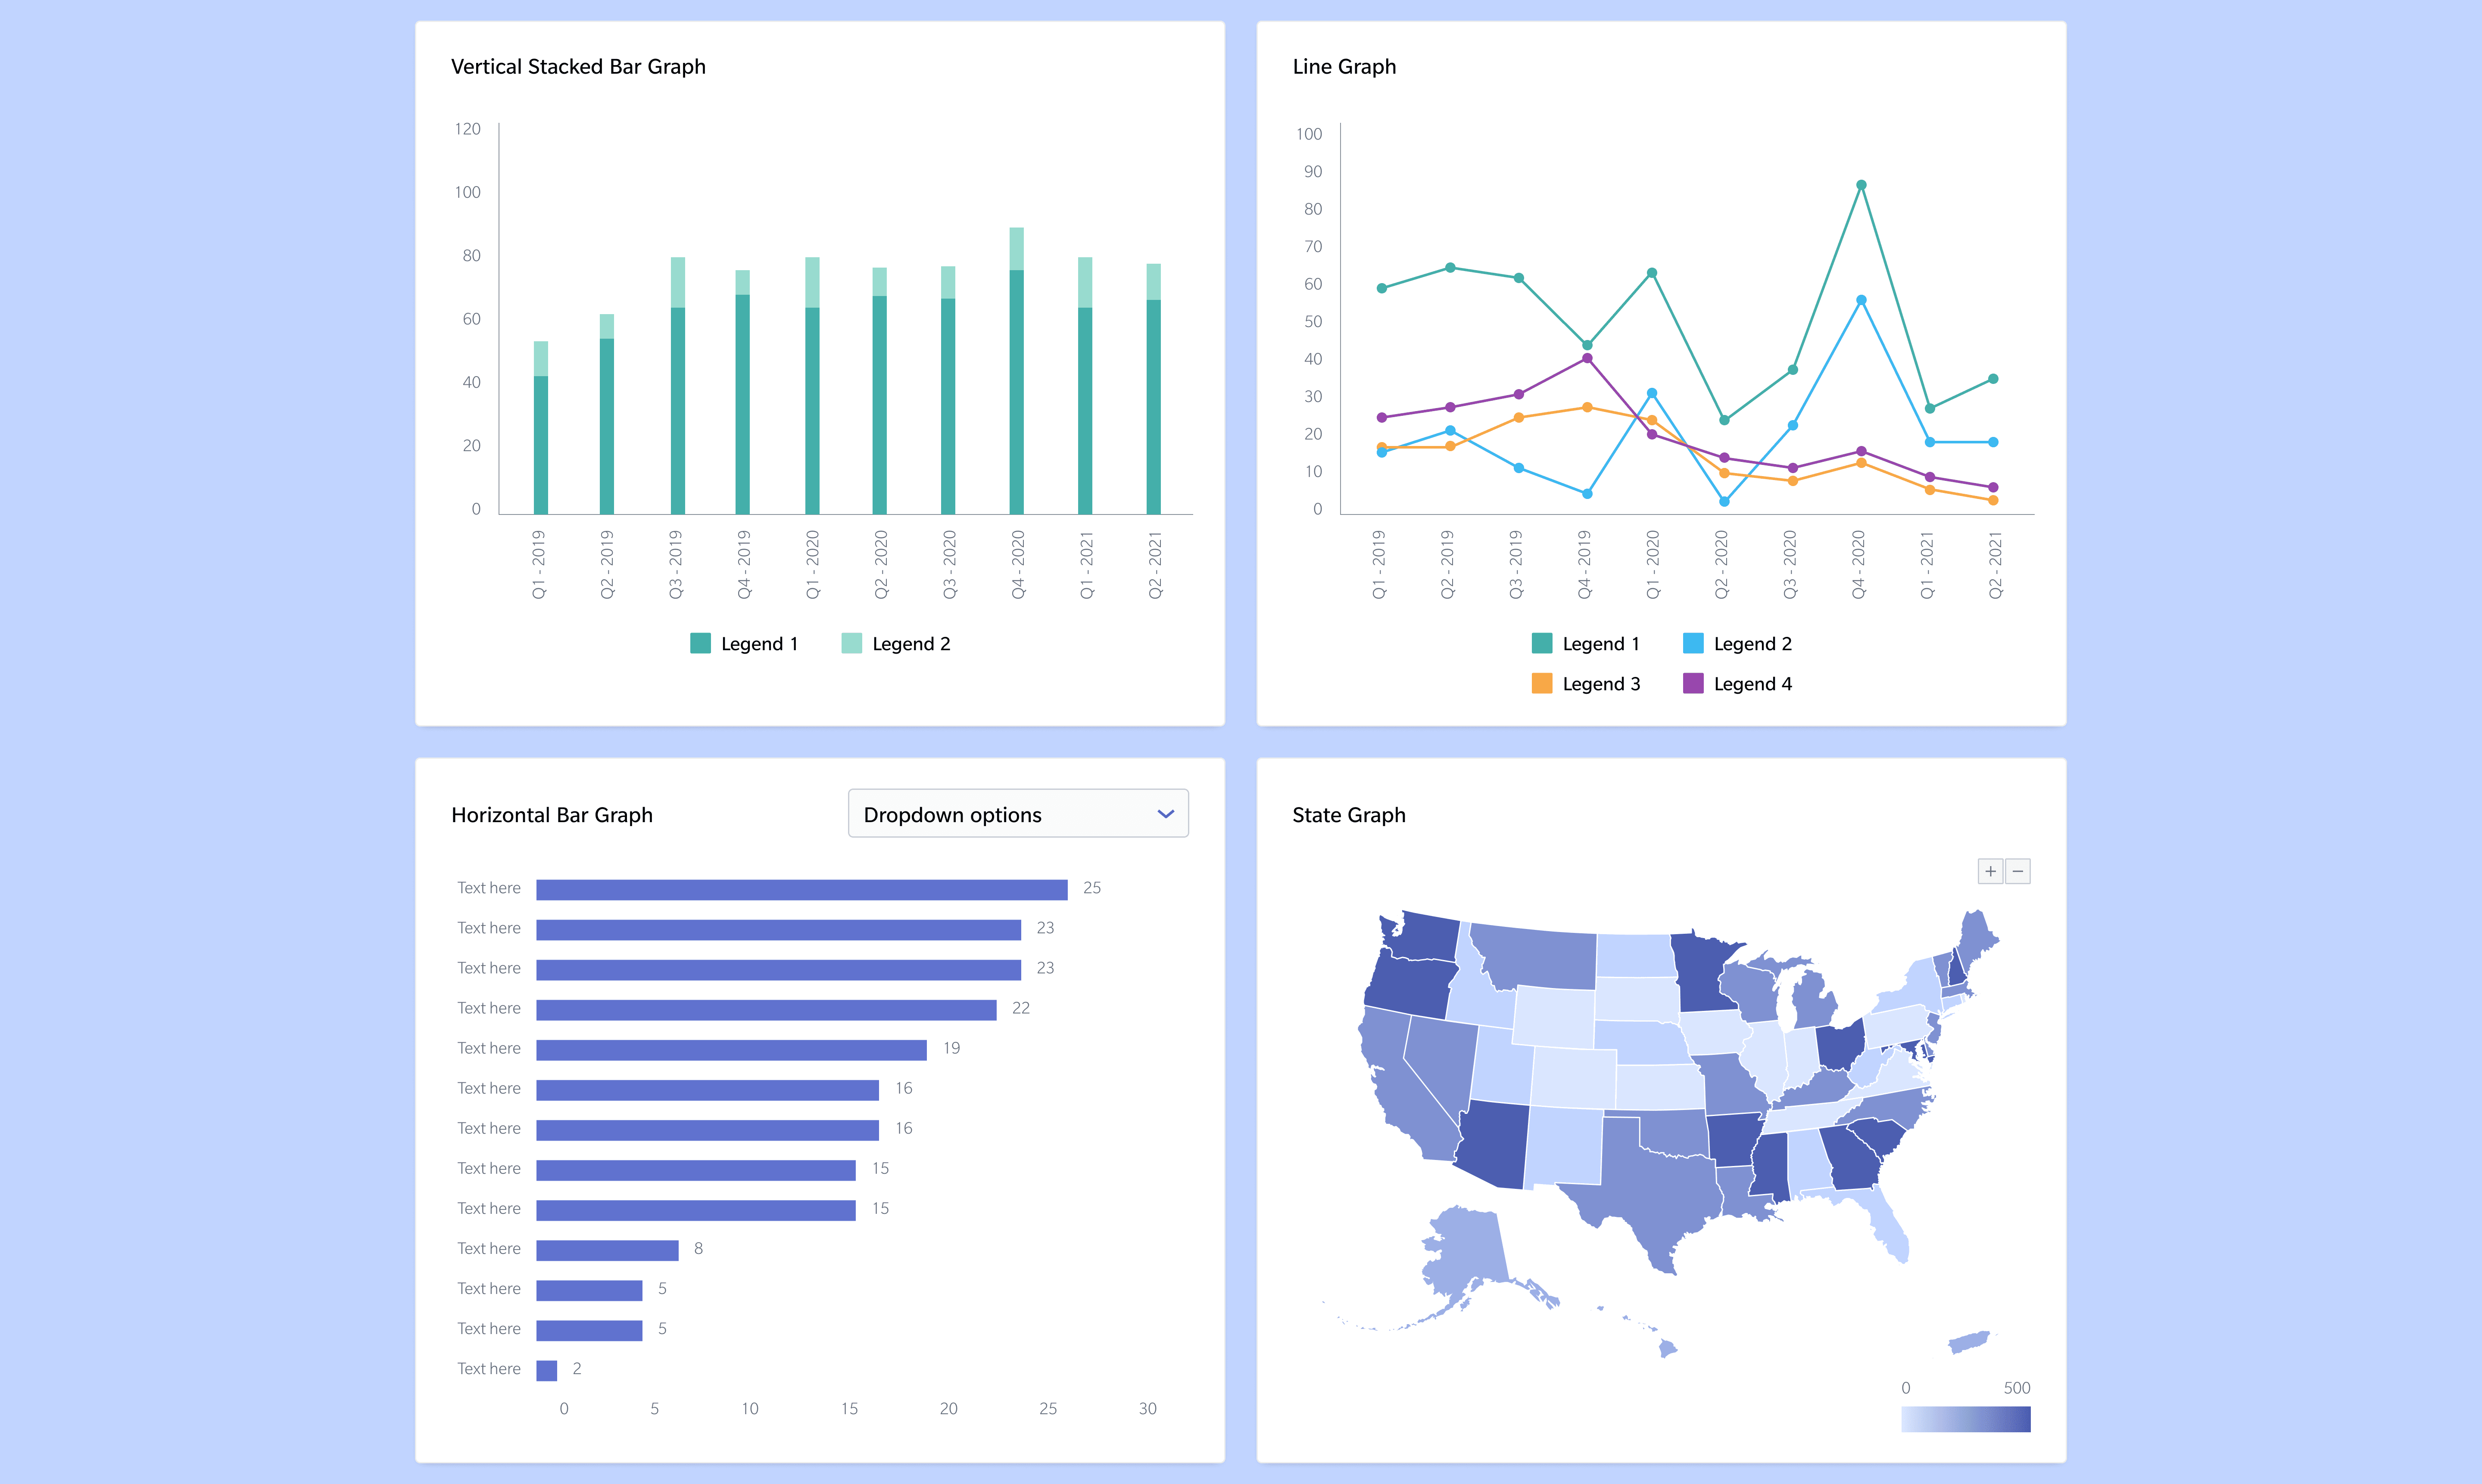
Contextual drill-downs
Contextual drill-downs maintained continuity from summary to detail, enabling managers and analysts to identify root causes without losing decision context
Scalable Design System
Established a design system that standardized analytical patterns, helping teams ship faster, maintain consistency, and support long-term platform scalability.
IMPACT
From insight to action
30% analyst time savings
Analysts shifted time from assembling reports to investigating patterns and supporting advisory decisions
2× faster risk identification
Executives and managers identified emerging risk and backlog directly from summary views, without waiting on manual reporting.
40% reduction in future development costs
A reusable analytics design system minimized one-off design work and rework across regions and Lines of Business.
REFLECTIONS
What This Taught Me
This was my first experience working directly with a client without a manager as an intermediary, collaborating closely with a product manager, and participating in sprint planning.
Navigating these responsibilities sharpened my ability to translate ambiguous requirements into structured design decisions, communicate tradeoffs confidently, and operate effectively within cross-functional delivery cycles.
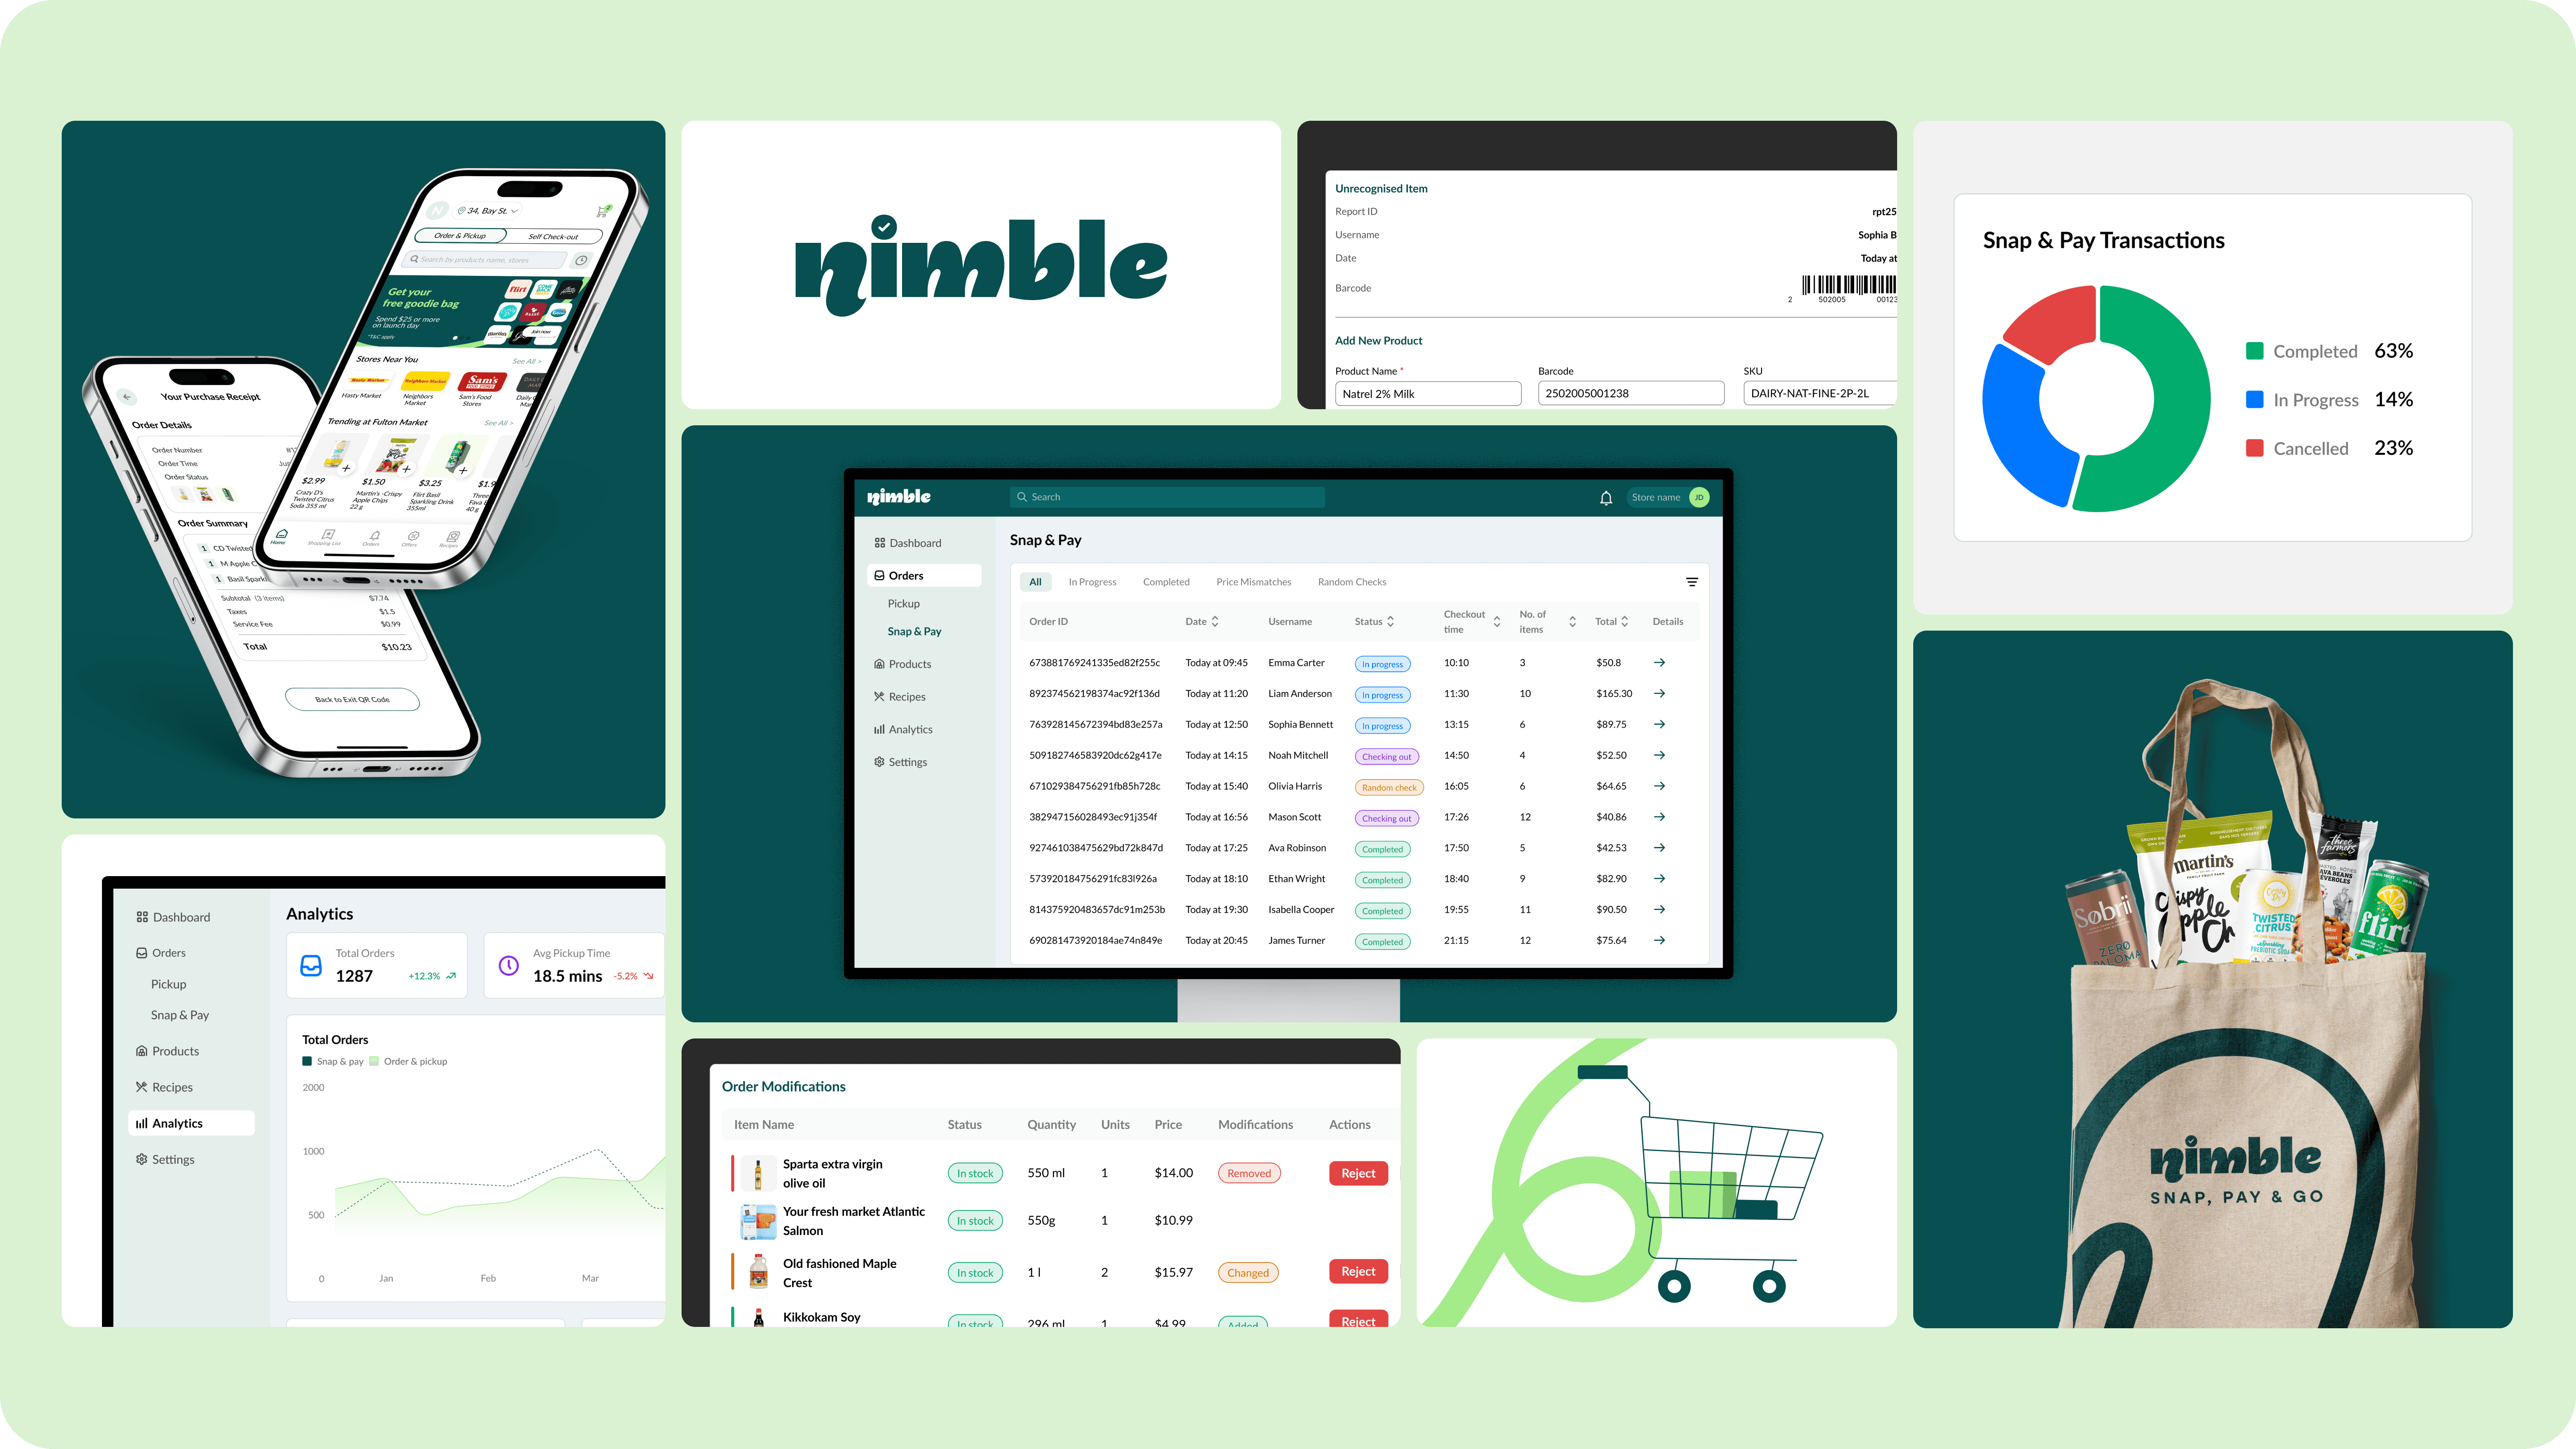

BHARGAVI VISWANATHAN
Product Designer currently crafting experiences at Nimble
bhargavi.designs19@gmail.com